TRENDING:

Adventures of Max and Voltaire™
System 001 Launched
Epping Forest
  • Test
    • Others
      • Articles
        • Recommended
          • Videos

Select Page

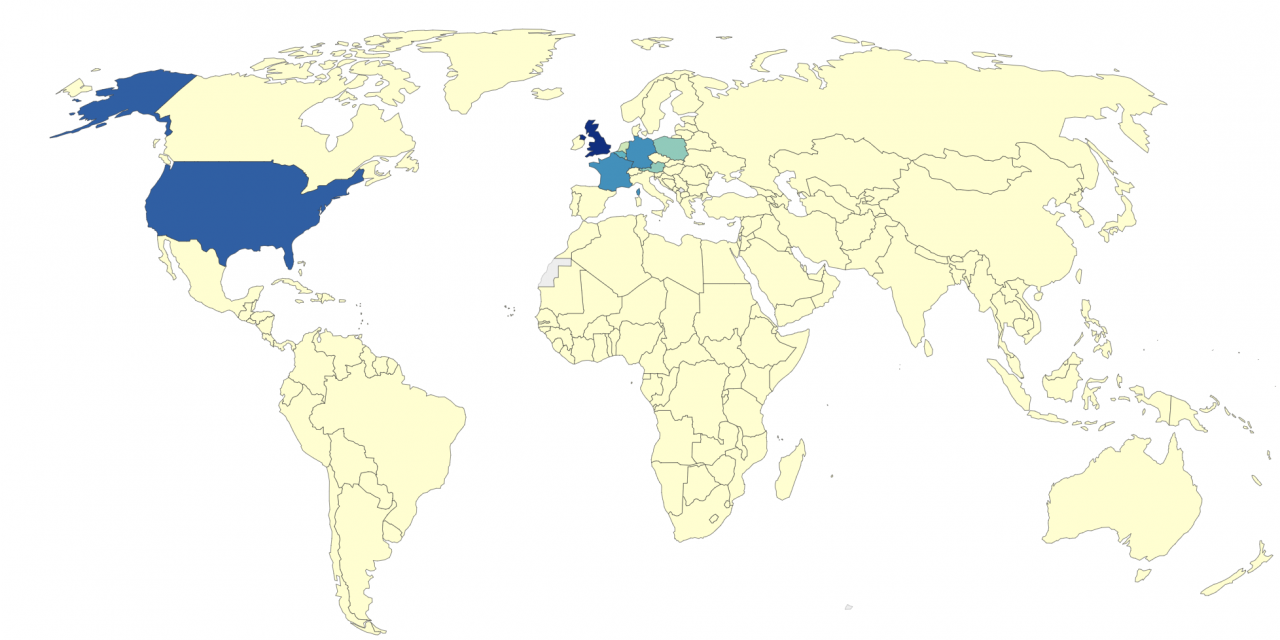
A map of global cumulative CO2 emissions over time

Posted by Ann Onyme | 16/01/2019 | Climate, Contribution, Planet | 0 |

A map of global cumulative CO2 emissions over time
From Our World in Data

Share:

Rate:

PreviousGrève du climat 15 mars 2019
NextTemperature anomaly

Related Posts

Coronavirus and Climate Change

Coronavirus and Climate Change

May 20, 2020

Measures to make livestock production sustainable

Measures to make livestock production sustainable

August 15, 2016

Temperature anomaly

Temperature anomaly

January 28, 2019

Livestock, Environment & Learnings

Livestock, Environment & Learnings

April 11, 2015

Leave a reply Cancel reply

You must be logged in to post a comment.

Designed by Elegant Themes | Powered by WordPress